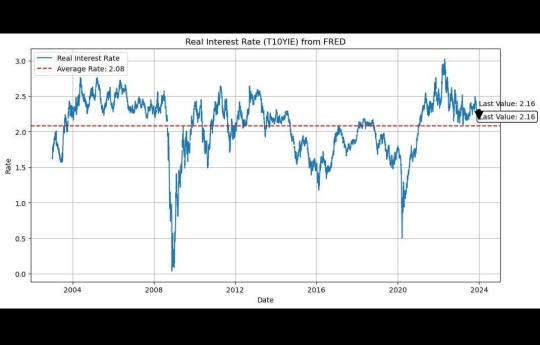
The plan describes the historical trend of real interest rates (T10YIE) in Federal Reserve Economic Data (FRED) from around 2004 to early 2024. The blue line represents the value of the actual interest rate, while the red line represents an average of 2.08% over the entire period.
금리인하가 실제 시작되는지 여부가 이제부터 중요한데
경기침체로 슬슬 지표가 움직이고 있고 고용도 차츰 줄어드는 추세니까 조금씩 조금씩 빼지않을까 생각도 드네요 슬슬 원화로 환전해야하는 시기가 아닌가 싶기도 합니다.
침체신호가 나타나다보니까 달러도 확 빠지려는 모습을 보여주네요 이러면 테슬라 숏을하는게 더 유리하려나?
싶기도 하네요
TMF에 이제 현실적으로 강한 베팅을 해야하는 시기가 아닌가 싶은 상황입니다
연준파월이 이제부터 정책을 어떻게 짜는지기 중요한 구간인데, 금리인하는 전 절대적으로 악재로 보고있기때문에... 이제는 어느정도 위험대비를 해야하는 시기가 아닌가 싶네요
Actual interest rates show significant fluctuations throughout the timeline. It reached its highest level in the mid-2000s and reached about 3% between 2006 and 2007. In particular, during the 2008-2009 financial crisis, it surged sharply and fell below 0%.
After the financial crisis, real interest rates remained relatively low, fluctuating by 0-1% during the extended period until the end of the 2010s. There has been a gradual upward trend since 2018, but the rate has risen again over 2% in recent years.
The plot's most notable feature is a significant surge towards the timeline's end point, with real interest rates soaring to about 2.16% in early 2024, as noted by the plot's "Last Value: 2.16." Such a sharp increase could reflect current economic conditions or monetary policy decisions.
Overall, it emphasizes the cyclical nature of real interest rates and indicates high and low periods corresponding to various economic cycles and policy changes. The average of 2.08% serves as a reference point, and it is possible to compare and evaluate whether the current ratio is above or below the long-term average.
'달러환율' 카테고리의 다른 글
| 환율이 다시 강하게 오르고있다. (32) | 2024.06.24 |
|---|---|
| 달러 환율이 폭락했습니다 (59) | 2024.05.04 |
| 환율이 내려오지않으면 미국이 투자하기 유리 (33) | 2024.02.05 |
| 엔화 강세 진행 속도가 꽤 빠르게 진행되고 있습니다. (58) | 2023.12.08 |
| 달러가 계속해서 하락전망한다고 예측하는 글이 늘어났네요 (65) | 2023.11.29 |


